Thoughts of the Week.
By now our readers must have realized how entertaining I find relating emblematic songs to financial markets. When Prince made this song a hit in the mid-80s, he was talking about broken relationships and not stocks or bonds, of course. In our line of business, “doves” and “hawks” are characterizations given to central bank officials with reference to whether they are in favor of loose monetary policy (i.e. lower interest rates) or tighter (higher rates), respectively. President Trump would be the king of doves, if he was given the opportunity to run the FED, which (thank God) is not happening.
Last week, the doves were in major retreat on both sides of the Atlantic. The FED meeting on Wednesday was the first to light things up, and although rates were left unchanged, there was a lot of drama involved during the press conference. In a situation not experienced since 1992 , there were four voting members who disagreed. And if this does not sound like a lot , we should note that the Federal Open Market Committee (FOMC) consists of 12 voting members: the seven members of the Board of Governors of the Federal Reserve System, the president of the Federal Reserve Bank of New York, and four regional Federal Reserve Bank presidents, who serve one-year terms on a rotating basis.
But what really happened on Wednesday ? Three of the dissidents “voted against the inclusion of an easing bias in the statement“, or in plain English they disagreed with conveying the message to markets that the FED is more likely to cut than raise rates, because obviously they do not support such an action now. The fourth was the Trump-puppet, Mr. Miran, who was appointed a few months ago and he has been voting for rate cuts since then, in allegiance to his master. The drama then continued in the press conference. Mr. Powell announced that he is staying in the FED after his term as Chairman ends this month, an unprecedent event in the last 75 years, and which means two things a) he will be a voter for several next meetings and b) Mr. Miran will have to leave the committee, as he will be replaced by the new Chairman, who most probably will be Mr. Warsh. In conclusion, the FED is not going to become a home of “ultra doves” anytime soon and the market’s narrative of lower interest rates this year should start to be questioned.
The ECB delivered a similar hawkish message. Although interest rates were left unchanged as widely expected, the press conference, as well as the usual “ECB-sources” leaks afterwards to the media, unofficially preannounced that a rate hike should take place in early June, unless there is a major and sustainable drop in oil prices. The EUR money market has already priced this with almost 100% certainty.
Long-term yields play an important role on the trajectory of equities. Firstly, they are used to discount future cash flows, in order to arrive to a fair valuation of a company, hence the higher the denominator is the lower the valuation of a company should be, all other things being equal. Secondly, they have a real impact on the economy, as a rise has a direct impact on the cost of corporate borrowing and mortgages, not to mention the impact on the already stretched government debt, primarily in the US. The US 10yr yield at 4.40% might not pose a problem yet, but it is 10% higher since the start of the year (at 4%) and the trend appears to be up, if there is no sharp fall in inflation in the next 3-6 months. A 5% yield will crater markets.
These developments beg the question what happens next in equity markets. For now, the US markets are again in AI delirium and Europe is being sold because of oil prices’ impact on the region. I can’t help thinking of 2018 (see last week’s Chart of the week) , Trump’s second year in office, when the market eventually sold off in the summer because the FED kept raising interest rates. Actually, the 10yr yield back then had risen to 3.20% from 2.60% at the start of the year, representing a 25% rise, when the market sold off. Applying the same magnitude to today, we see that a 5% yield will represent a similar rise, and the consequences will be similar.
A very divided FED does not offer any solace, at the moment. I am sure that during the FED’s last meeting, Chairman Powell could have been humming Prince’s words in the famous pop song: “Why do we scream at each other? This is what it sounds like when doves cry“. Hence, as we said last week, we remain extremely vigilant both for equities and bonds. Our recently increased cash levels are here to stay for some time, until we see how the situation evolves in the next months.
Weekly highlights
Eurozone April inflation rose BY 0.4pp to 3% y/y in line with expectations. Looking in the details, energy was the key driver behind the rise rising by 10.9% y/y. On the positive side, Core inflation, which excludes food and energy fell to 2.2%. Expectations are now for inflation to rise to 3.3% in May, where hopefully it will peak unless there is major escalation in the war.
In the US March PCE Deflator rose to 3.5% , but slightly less than expected, 3.6%. We should note that this is the inflation metric that the FED targets (2%). Core PCE also rose to 3.2%, in-line with expectations.
The first US Tech Q1 reports were positive but stock performance was very mixed. Earnings were strong across the board with AI continuing to be the dominant growth driver. However, capital spending seems to be exploding and investor attention has turned again on Return On Investment rather than just growth. All companies announced an increase in their spending plans, which for the Big-4 (Amazon, Alphabet, Meta, Microsoft) is now estimated to exceed 700bn$ in 2026, up from 600bn$. The big winner of the week was Alphabet, which beat handsomely on all fronts and presented a huge backlog of cloud-related orders. The other three companies reported much lower free cash flow than expected, due to the extreme spending and investors took notice of that.
Markets’ reaction
Global equities had another rather mixed week, with most regions finishing in the red. US equities continued to outperform, a trend in place for a few weeks now, thanks to the Tech resurgence. Moves last week were, however, more muted with Nasdaq posting a 1% gain helping the S&P500 reaching a new record high. Europe has been underperforming for a third week in a row with its broad indices ending the week around the flatline. Energy was the best performing sector on both sides of the Atlantic as oil prices spiked close to their previous highs.
The bond market was volatile, with yields spiking after the FED meeting and the oil price surge. The US 10yr yield traded as high as 4.42% to finally settle at 4.37%, as oil prices fell from their highs. The German 10yr rose above 3.10% for the first time since 2011 , to finish the week at 3.04%. The short-end (1-3 years) is trading above 2.50%, which is pricing rate increases by the ECB in the coming months. We continue to favor positions in this segment.
Precious metals fell again, with Gold approaching the 4’500$ level before rebounding to 4’600. Technically, Gold does not look good, having lost its short-term momentum and trading below its 50-day moving average which has acted as a resistance. This sell-the-rally mode has been in place for several weeks, as we had highlighted it in March and the big support lies closer to 4’300$, where its 200day moving average resides.
The foreign exchange market was also volatile. The EURUSD finished the week at 1.1740 after a brief trip closer to 1.1600, while there was drama in the Japanese Yen crosses as reports circulated about the BoJ intervening in the market to stem the currency’s fall.
Chart of the week: The US is not as protected as widely believed, in case of an energy shock.
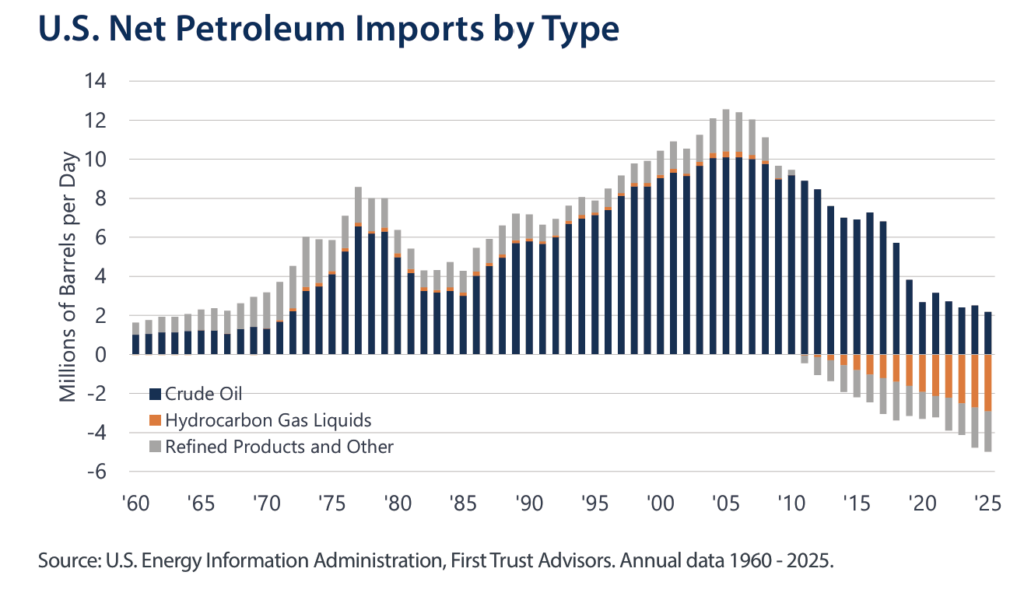
Just two decades ago, the U.S. was a net importer of more than 12 million barrels per day (bpd) of petroleum, but the shale revolution in 2015 has dramatically reshaped that balance. By 2020, the U.S. became a net exporter of petroleum for the first time since 1949, and by 2025 remained a net exporter for the fifth straight year, with roughly 10.7 million bpd of exports versus 7.9 million bpd of imports. However, the U.S. is still a net crude oil importer, as can be seen by the dark blue bar at the far right side of the chart. Much of this imported crude is refined domestically into products like gasoline, diesel, and jet fuel, which are then exported, highlighting the U.S.’s growing role as a global refining hub rather than a purely self-sufficient oil producer. American refineries have invested heavily to process heavier, high-sulfur crude oil to ensure a steady supply of gasoline, diesel, and jet fuel. That legacy still shapes the system today: heavy crude oil remains critical, with Canada supplying the bulk of it – accounting for 62% of total U.S. crude oil imports and 24% of U.S. refinery throughput in 2024. Meanwhile, the surge in domestic production from US shale technology has produced mostly light sweet crude oil – higher quality, but not what many U.S. refineries are optimized to run. Retooling refineries to rely solely on domestic crude oil would cost billions, take years if not decades, and run into infrastructure bottlenecks, including pipeline networks built for heavier grades. As a result, much of the light crude oil boom is exported, while U.S. refiners continue to depend on imported heavy barrels. Hence, the price of gasoline for the end US consumer is not as protected as “common wisdom” has it.
Sources : Chart: First Trust
The content of this document has been produced from publicly available information as well as from internal research and rigorous efforts have been made to verify the accuracy and reasonableness of the hypotheses used. Although unlikely, omissions or errors might however happen.
The data included in this document are based on past performances and do not constitute an indicator or a guarantee of future performances. Performances are not constant over time and can be positive or negative.
This document is intended for informational purposes only and should not be construed as an offer or solicitation for the purchase or sale of any financial instrument and it should not be considered as investment advice. The market valuations, views, and calculations contained herein are estimates only and are subject to change without notice. Any investment decision needs to be discussed with your advisor and cannot be based only on this document.
This document is strictly confidential and should not be distributed further without the explicit consent of Kendra Securities House SA.