Thoughts of the week
This is not meant to be a weather forecast. As an introduction, July is my second most favorite month (December being the top pick). It is the month residing in the middle of the summer and vacations are fast approaching. In June it is too early to start thinking about frozen Margaritas on a Greek beach and August always carries the “back-to-school” blues. July also finds itself in the middle of the year, when a necessary self-assessment is taking place, crossing out the resolutions achieved and circling those that still have to be accomplished. Updated resolutions and new plans for the second half are also on the agenda. Same for investment strategy.
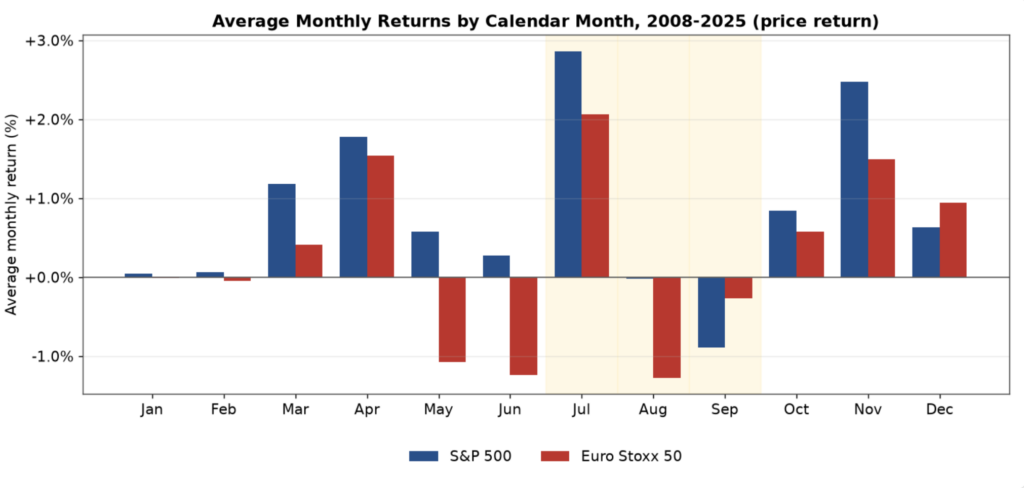
But July is also one of the hottest months for markets. The average July return for the S&P 500 since 2006 is +2.9% and for the Euro Stoxx 50 is +2.1%, with 83% and 72% success rates respectively. The median return for the S&P500 is 2.2% and for Euro Stoxx +1.1%. The largest July gains were registered in 2009 (9.8% for Europe and 9.1% for S&P500), as the 2008 bear market had ended. The worst July occurred in 2011 for both regions (-2.2% and -6.3%) but this was during the Eurozone crisis. Even more impressively, the S&P 500 had positive Julys in all of the last ten years, including the years when it finally ended negative. The Euro Stoxx 50 had only 3 negative Julys in the last ten years, namely in 2019 (-0.2%) in 2020 (-1.9%) and in 2024 (-0.4%) .
Could history repeat itself ? Most probably, yes. As a starter, the US main indices have already taken a breather in June, with the S&P500 falling almost 4% from peak to trough and the Nasdaq down about 8% in the same context. The sell-off was clearly concentrated in overcrowded Tech names, such as semiconductors, which have grown to become almost 25% of the S&P500 index, a clearly unsustainable weight. But in the next weeks, momentum chasers and traders afraid of missing out could attempt to build positions again, ahead of the Q2 results in the second half of July. The other possible threat to markets, the FED, is not meeting until the very end of the month, and the ECB July meeting is not expected to produce another rate hike, especially after the recent data and the fall in oil prices.
But there is one more reason why July and the rest of the summer could be “hot”: the extreme leverage in the AI capex theme globally. Margin lending in the US is through the roof and there is anecdotal evidence that Korean people are quitting their jobs because they make more money in the stock market (Hynix/Samsung). In our region, hedge funds have been shorting European consumer names and other laggards to double up positions in the memory chip stocks and AI beneficiaries. Indicative of the already installed nervousness among traders is the fact that Samsung has moved +/-5% on 12 of 21 days in June and all three so far in July. Investors using leverage simply can’t sustain high levels of leverage when volatility increases ; this is both psychological but also mechanical as VAR (value at risk) algorithmic programs force them to sell positions.
Is it possible to have a sell-off in momentum and markets manage to move higher ? The answer is clearly yes, but it depends which index/market you are following. The fact that laggard stocks have been a source of funding for levered positions means that short-covering these will lead to sizeable rallies. And we already have had a real “crash-test” in June. For those who do not follow it, we note that the S&P500 Equal Weight index was slightly positive in this period and last week it closed at a record high, at a time when the S&P500 and Nasdaq struggled. At the same time, Europe had a solid June and continues to do better despite the stall in momentum stocks. The rest of the market offers significant opportunities for long-term investments and these will have the tailwind of traders chasing them to cover their shorts or running to participate in the next rotation. Bottomline, the temperature among traders and investors will be high, regardless of the final direction of the markets.
Our half-year new resolution has been to become a little more defensive and protect performance, at least for now. As you have already read in this newsletter, we have trimmed positions in momentum trades and have already started buying beaten-down defensives to reduce our beta exposure. But we have also added to cyclicals (discretionary, financials) with compelling valuations to bet on better economic growth apart from the AI capex. Our European Focus-20 portfolio has now a beta of only 0.8 , down from 1.3 just a few weeks ago. (beta is the sensitivity to market moves). Our High Conviction portfolio is closer to 1.0 but market exposure is also fast moving down from the recent high. This means that we are going to participate nicely in a July rally , we will do extremely well if the rotation out of AI capex into other sectors continues and we will be somewhat protected in a bear scenario. That frozen margarita needs a peace of mind too.
Weekly highlights
Eurozone June inflation fell 0.4pp to 2.8% y/y, below consensus of 3%. As expected, the main driver behind the fall in headline was a decline in energy inflation, although lower core and food inflation also contributed to the decline. More specifically, core inflation was down 0.2pp to 2.4%, below consensus of 2.5%. Services inflation declined to 3.2% while goods inflation remained unchanged at 0.9% y/y. Looking ahead, while we think inflation probably peaked in May at 3.2%, but it should stay in the range of 2.8-3% for the rest of the year.
The US labor market data were mixed. The June Non Farm fell to +57k in June, markedly lower than consensus (+113k) and previous months were revised down a total of -74k. But overall the 3month moving average remained at a still respectable pace of gains. The unemployment rate fell to 4.2% from 4.3%, but this was also due to a further fall in the participation rate, or in other words more people leaving the labor market permanently and hence taken out of the “unemployed” category. Interestingly, the participation rate has now fallen by 0.5% in four months which is among the largest (outside of recession) in the last 60 years. It happened during the pandemic and the global financial crisis.
The German government announced last Thursday a significant reform package. It consists of 34 measures focusing on pension reform, income tax cuts, labor market flexibility and the easing of bureaucracy hurdles. From an investment perspective, the most important measures are those linked to the labor market with the aim to increase flexibility, a long-held desire of international investors. Specifically, temporary work contracts could now be extended 6 times (up from 3 times currently) and be used for a total of up to 4 years (up from 2 years currently). Equally important, employment protection will be eased for higher income workers and severance payments will receive preferential tax treatment. These measures should have a positive impact on investor sentiment, signaling a more business-friendly environment.
Markets’ reaction
Global equities had a solid, positive week. Europe (+3%) outperformed again the US, a trend in place since the beginning of June. In terms of sectors, Financials (+3%) outperformed on a global scale, followed by Healthcare (+2.5%) and Discretionary (+2.5%). In our portfolios we have recently increased Financials (JPM Morgan and Munich Re) while adding to laggard European consumer names as well.
The bond market was slightly negative, despite the good Eurozone inflation numbers and the weak US labor market data. This shows that the recent rally has probably discounted all “good” data and there are few catalysts that would make yield move significantly lower from current levels. The US 10yr is pinned around 4.50% and the German bund at 2.90%.
Gold rallied together with other precious metals. After several tests of the levels slightly below 4’000$, traders finally pushed it much higher to close the week closer to 4’200$. Its technical picture still does not look, however.
The dollar weakened, after the US jobs data. The EURUSD rose to 1.1450, after spending some time below 1.1400 at the start of the week.
Chart of the week: The period after July is usually turbulent.
Source: Perplexity
The above chart shows the average monthly performance of the S&P500 (blue) and the Euro Stoxx 50 (red) since the global financial crisis. As can be seen in the chart, July is the best month, with November coming second, both in Europe and the US. Interestingly, this period is then followed by higher volatility and down markets, into September. It should also be noted that significantly lower volumes due to vacations in August tend to exacerbate the moves, in any direction and some profit taking ahead of the remaining summer becomes a natural human behavior. This chart is shown purely for informational purposes and of course it is not wise to base any investment decision on seasonal patterns alone.
The content of this document has been produced from publicly available information as well as from internal research and rigorous efforts have been made to verify the accuracy and reasonableness of the hypotheses used. Although unlikely, omissions or errors might however happen.
The data included in this document are based on past performances and do not constitute an indicator or a guarantee of future performances. Performances are not constant over time and can be positive or negative.
This document is intended for informational purposes only and should not be construed as an offer or solicitation for the purchase or sale of any financial instrument and it should not be considered as investment advice. The market valuations, views, and calculations contained herein are estimates only and are subject to change without notice. Any investment decision needs to be discussed with your advisor and cannot be based only on this document.
This document is strictly confidential and should not be distributed further without the explicit consent of Kendra Securities House SA.