Thoughts of the week.
Green Day’s hit song of the early 2000s could not be more appropriate for financial markets. Billie Joe Armstrong, the band’s lead singer, lost his father from cancer in 1982, when he was only 10 years old. Overwhelmed, after the funeral, he locked himself in his bedroom. When his mother knocked to check on him, he famously told her, “Wake me up when September ends,” wanting to sleep through the pain of the month. We kind of have a similar feeling.
People in the money management business, especially the older ones, have various preconceptions, which from time to time have been mentioned in our weekly newsletters. One of them is the “September effect”, or in other words the fact that September is typically a bad month for markets. Another preconception that haunts us is that most major crashes have happened in October, which means that the period which has just started makes people nervous, even if things turn out to finally be different. Looking at the data, since 2000 there have been 13 positive vs. 13 negative Septembers , which is basically a coin flip, but the down years tend to be sharper. The worst were 2002 (-11.0%), 2008 (-9.1%), and 2022 (-9.3%). More recent Septembers have been mixed but have been trending better: 2023 was down nearly 5%, while 2024 and 2025 were both positive (+2.0% and +3.5%). Since 1950, the S&P 500 has averaged about -0.6% , making September statistically the worst month for equities.
Turning to facts rather than superstition, we have various events coming up which could derail the nice rally we have been enjoying lately. The most important catalyst will be the central bank decisions in the next two weeks. The ECB is meeting this coming Thursday and the most probable outcome is a rate hike. This has been well telegraphed by senior ECB officials in the last two months. Mrs. Lagarde both at the June and July meetings said that “several governors had openly supported a rate increase” and stressed that the milder energy-price scenario that the ECB had assumed in March now “looks quite unlikely.” The FED meeting comes the following week, on September 16. Here, no real forecast can be made. If we take the Chairman’s recent words at face value in combination with inflation still far from the 2% target and the strong labor market data of last week, the most probable scenario is also for a rate hike. Then again, President Trump said last week that he is expecting a rate … cut, and if this is not delivered he will he would “stop trading with countries that run trade deficits with the U.S” i.e., with most part of the world … One cannot imagine what the market implications would be if this scenario materializes, which of course most probably is one of those empty threats that the US President often makes.
There is however hope that September could turn out differently than tradition suggests. A very positive catalyst would be the final ending of the military conflict in Iran , with Trump withdrawing for good from the region and oil prices collapsing to levels closer to 60-70$ per barrel. This scenario holds a higher probability than what the actual situation on the ground now offers, simply because the US midterm elections are fast approaching (November 3rd). We assume that Trump would not want to go to elections with oil prices north of 90$, treasury yields at multi year highs and a FED willing to push short-term rates higher, which also means a weak stock market. On the company fundamentals side, things still appear rosy as we have already discussed and expected earnings growth both in Europe and the US is still very solid. If the bond market can stabilize sustainably, there will be an all-clear signal for a late-year rally.
We decided to take some tactical action in portfolios. This involved, among other minor movements, cutting our French exposure (BNP, Veolia) due to the increased risk for political chaos and we raised cash to relatively high levels. In our High Conviction portfolio, cash is now about 10%, the highest in many months. At the same time, if the situation with oil prices and bond yields stabilizes, we will be quick to deploy the cash, even if that means buying at higher prices than we would have wanted to. Protecting part of this year’s performance and avoiding large drawdowns is the primary goal, at this stage.
Weekly highlights.
Eurozone August inflation rose to 3.3%, as expected. The rise in Energy prices was the main, if not only, reason for the spike as Core CPI (which excludes energy and food) remained under control at 2.4%. Still the headline number should push the ECB into raising rates this coming Thursday.
The US labor market rebounded in August. Nonfarm payrolls were published at +162k in August , much higher than consensus for +55k. July’s surprise drop (-22k) was revised higher to an increase of 22k (i.e. revised by +44k) while June’s numbers were also revised higher by 10k. The labor market in August was supported by a strong rebound in government employment and a solid 127k increase in private employment. The unemployment rate held steady at 4.1%.
Oil prices remained elevated, although Trump said that any more strikes in Iran will be short-lived. Of course, he had also said that the D-day is approaching for Iran about a month ago, but I guess the Treasury reminded him that their foreign creditors will probably not like the idea.
Markets’ reaction.
Global equities did not make any meaningful move. US equities managed to outperform with a late-week rally after bond yields stabilized , with Nasdaq closing up 0.3% and S&P500 marginally higher. Europe on the contrary was under pressure, with the broad indices losing 1% and Germany underperforming (-2%) with Switzerland (+0.1%) providing some cushion. In Asia, Japan lost 2% as global markets are again focused on the local bond market and what the central bank will do.
The bond market moved further lower, although the move was arrested towards the end of the week. The 10yr US Treasury touched the 4.80% level and the 10yr Bund reached 3.40%, the highest level since the Eurozone crisis in 2011.
Gold traded lower, but managed to rebound. The yellow metal closed the week almost unchanged and just a touch above the 4’400$ level.
The dollar weakened against most major currencies. There seems to be a stealth intervention, in coordination between the US and Japanese treasuries to stem the fall of the yen, which will lead to a stabilization of the bond market. The EURUSD rose to 1.1630.
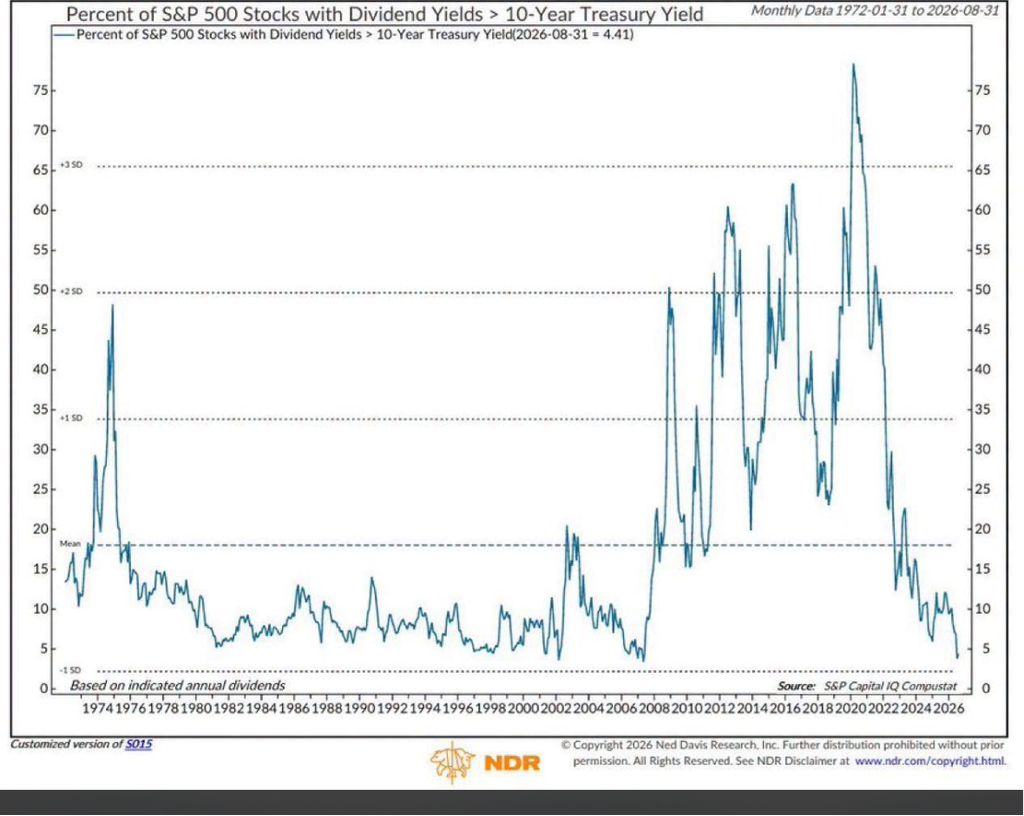
Chart of the week: The number of S&P500 stocks yielding more than the 10yr Treasury is at 2007 levels.
Source: NDR
The above chart shows the percentage of stocks of the S&P500 index, whose dividend yield is higher than the US 10 Treasury yield, going back to the ’70s. As we can see the current percentage has fallen below 5%, which is the lowest since before the 2008 financial crisis. Before jumping to conclusions it is important to note a few things. The dividend yield moves higher by definition when there is a steep correction in the price of stocks as the denominator in the dividend/share price ratio is decreasing. Hence during crises the percentage of stocks yielding higher than the treasury will be much larger than during normal times. Second, when the yield of the Treasury is very low, as has been the case in the years after the Eurozone crisis and after Covid, again the percentage will be large. Still, however, this metric provides some useful information. It is almost certain that such a low percentage of stocks yielding above the 10yr is not a tailwind for the stock market as there is real competition for capital by long-term bonds to stocks. To get out of the situation we need the yields to move significantly lower and hence equity income to become attractive again.
The content of this document has been produced from publicly available information as well as from internal research and rigorous efforts have been made to verify the accuracy and reasonableness of the hypotheses used. Although unlikely, omissions or errors might however happen.
The data included in this document are based on past performances and do not constitute an indicator or a guarantee of future performances. Performances are not constant over time and can be positive or negative.
This document is intended for informational purposes only and should not be construed as an offer or solicitation for the purchase or sale of any financial instrument and it should not be considered as investment advice. The market valuations, views, and calculations contained herein are estimates only and are subject to change without notice. Any investment decision needs to be discussed with your advisor and cannot be based only on this document.
This document is strictly confidential and should not be distributed further without the explicit consent of Kendra Securities House SA.